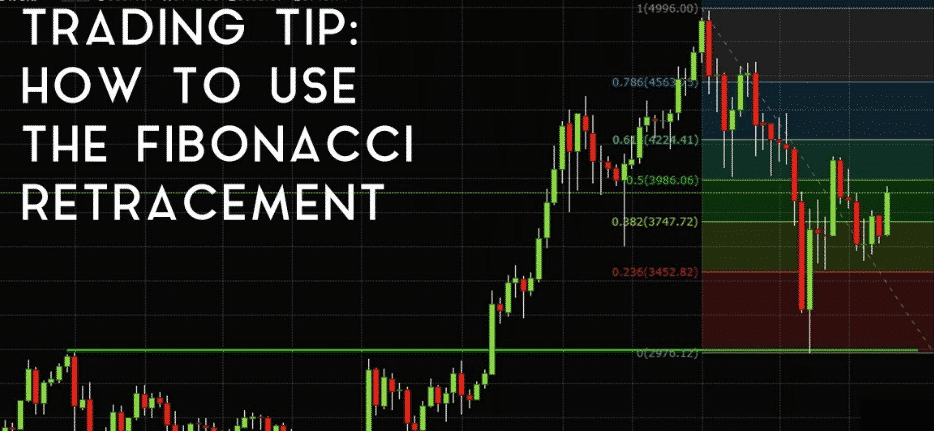
Let’s talk about Fibonacci levels of retracement.
Fibonacci retracement levels are horizontal lines that show potential price reversal levels.
The Fibonacci technique works best when the market is trending, which is the first thing you should know about it. When the market is heading up, the aim is to go long (or purchase) on a pullback near a Fibonacci support level. When the market is going DOWN, go short (or sell) on a pullback at a Fibonacci resistance level.
Because they attempt to foretell where price will be in the future, Fibonacci retracement levels are considered a predictive technical indicator.
The theory is that after price begins a new trend direction, the price will retrace or return partway back to a previous price level before resuming in the direction of its trend.
Finding Fibonacci Retracement Levels
You must first locate recent key Swing Highs and Swing Lows in order to locate these Fibonacci retracement levels.
When it comes to uptrends, the opposite is true. Drag the pointer to the most recent Swing High by clicking on the Swing Low.
Got that?
Now, let’s take a look at some examples of how to apply Fibonacci retracement levels to the currency markets.
Uptrend
This is a daily chart of AUD/USD.
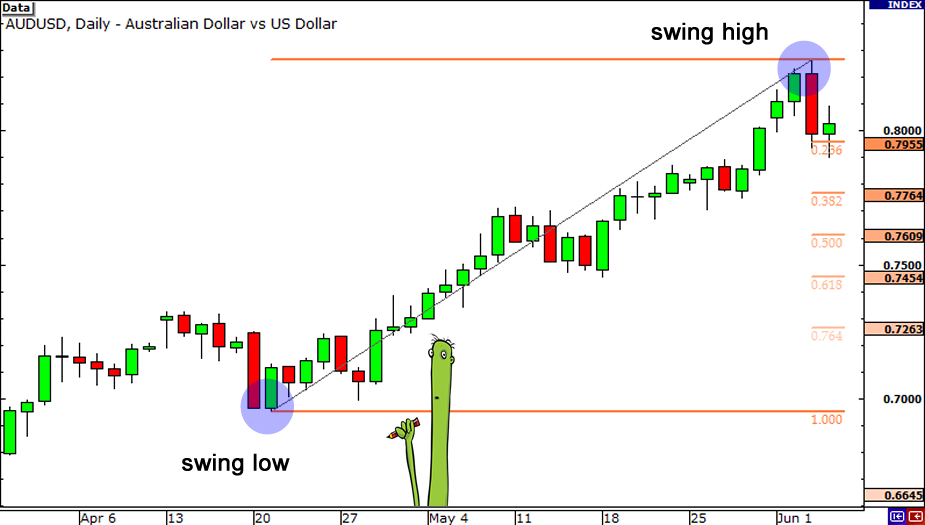
By dragging the cursor from the Swing Low at.6955 on April 20 to the Swing High at.8264 on June 3, we were able to plot the Fibonacci retracement levels.
Tada! The retracement levels are calculated and shown automatically by the charting program.
The Fibonacci retracement levels were.7955 (23.6%),.7764 (38.2%),.7609 (50.0% *),.7454 (61.8%), and.7263, as shown in the chart (76.4% ).
The anticipation now is that if the AUD/USD retraces from its recent high, it will find support at one of the Fibonacci retracement levels since traders will be placing buy orders at these levels as the price drops.
*The 50.0% ratio is not officially a Fibonacci ratio, but it was able to sneak into the group and has never left.
Now, let’s look at what happened after the Swing High occurred.
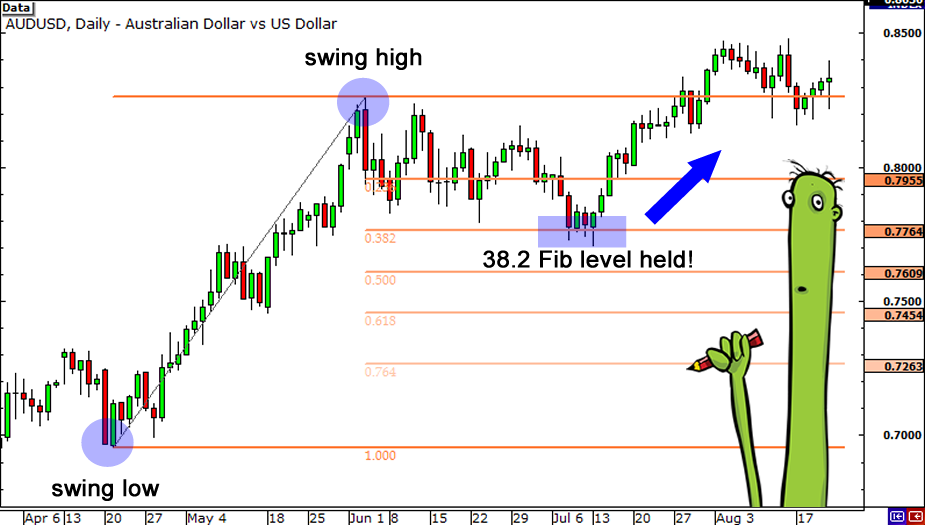
Price pulled back right through the 23.6% level and continued to shoot down over the next couple of weeks.
It even went as low as 38.2 percent, but couldn’t close below it.
Around July 14, the market began to rise again, eventually breaking through the swing high.
Buying at the Fibonacci level of 38.2 percent would have clearly been a lucrative long-term trade!
Downtrend
Now, let’s see how we would use the Fibonacci retracement tool during a downtrend. Below is a 4-hour chart of EUR/USD.
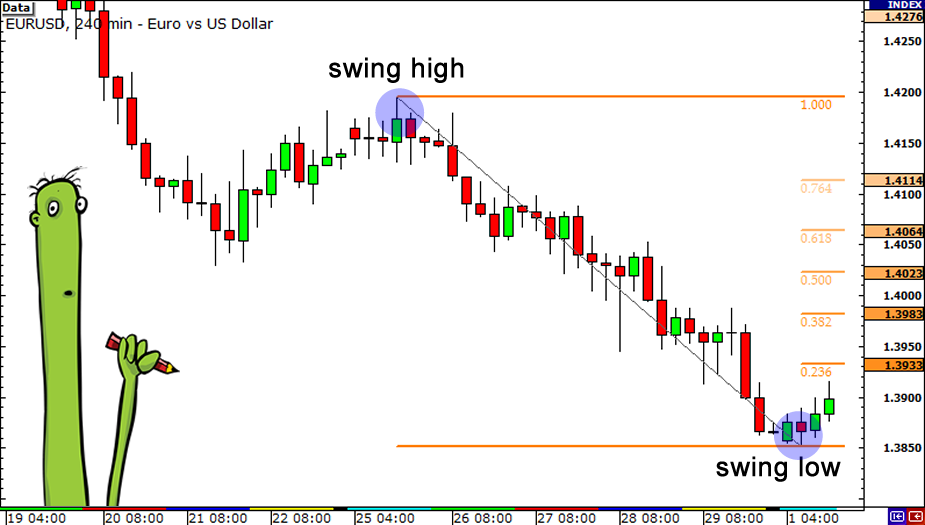
As you can see, we found our Swing High at 1.4195 on January 25 and our Swing Low at 1.3854 a few days later on February 1. The retracement levels are 1.3933 (23.6%), 1.3983 (38.2%), 1.4023 (50.0%), 1.4064 (61.8%) and 1.4114 (76.4%).
If the price retraces from this low, traders who wish to play the downtrend at better prices may be ready with sell orders at one of the Fibonacci levels, so if the price retraces from this low, it might perhaps find resistance at one of the Fibonacci levels.
Let’s take a look at what went on after that.
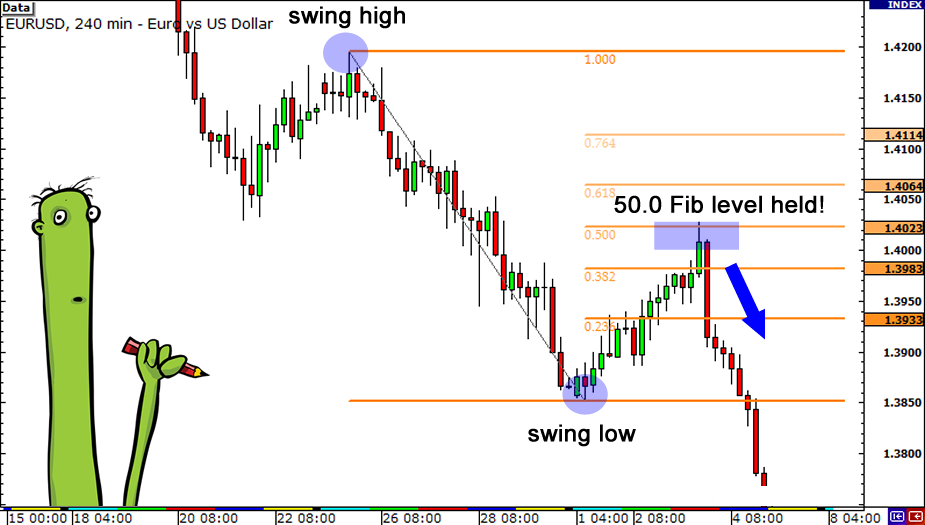
Yowza! Isn’t that a work of art?!
The market did try to rise, but it paused for a while below the 38.2 percent level before attempting the 50.0 percent barrier.
You could have gained a lot more money on that transaction if you had placed orders at 38.2 percent or 50.0 percent.
Price found some transient FX support or resistance near Fibonacci retracement levels in these two examples.
Because so many individuals utilize the Fibonacci technique, those levels of support and resistance become self-fulfilling.
If a large number of market players anticipate a retracement will occur at a Fibonacci retracement level and are ready to open a position when the price hits that level, the market price may be influenced by all of those pending orders.
One thing to keep in mind is that pricing does not always bounce back from these levels. They should be treated as regions of interest, or “KILL ZONES!” as Cyclops likes to call them. Later on, we’ll go through that in further detail.
For the time being, one thing to keep in mind when utilizing the Fibonacci tool is that it is not always simple to use!
If things were so simple, traders would place their orders at Fibonacci retracement levels all the time, and the markets would continue to trend indefinitely.
Looking for a highly rated forex fund manager?
Fx Pips Guru has a strong group of forex experts who are managing forex accounts of our clients from different brokers dedicatedly. Just hire our forex fund managers here : https://www.fxpipsguru.com/forex-fund-manager/ .