The Forex Keltner Channel is a volatility indicator created by Chester Keltner. It is a grain trader, in his 1960 book How To Make Money in Commodities.
Linda Raschke later produced an updated version in the 1980s.
Linda’s Keltner Channel, which is more often used, is quite similar to Bollinger Bands in that it has three lines as well.
In a Forex Keltner Channel, the central line is an Exponential Moving Average (EMA), while the two outer lines are based on the Average True Range (ATR) rather than standard deviations (SD).
The Keltner Channel contracts and expands with volatility. But not as much as the Bollinger Bands, because it is derived from the ATR, which is a volatility indicator.
Keltner Channels are used to set trading entry and exit points.
When the trend is flat, the Keltner Channel can help identify overbought and oversold levels relative to a moving average.
It might also provide you with hints about emerging trends.
Consider the channel to be similar to an ascending or descending channel. But it adjusts to recent volatility and isn’t made up of straight lines.
If you read our Bollinger Bands course, you can probably infer that Keltner Channels are made from the same fabric. That is, almost.
The underlying signs and calculations that we might go on and on about. But that would lull you to sleep, are what distinguishes these two.
Let’s just state that various algorithms result in disparities in price sensitivity and indication smoothness.
How to Trade Using Forex Keltner Channel
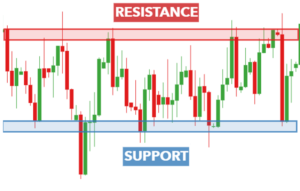
Keltner Channels depict the typical trading range of a currency pair.
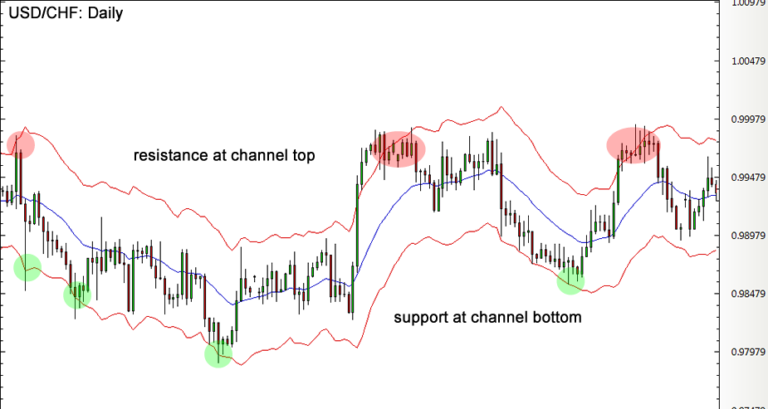
Typically, the channel top acts as dynamic resistance, while the channel bottom acts as dynamic support.
How to Use Forex Keltner Channel as Dynamic Support and Resistance Levels
The most popular values for the upper and lower lines are 2 x ATR (10) and EMA (20). These are for the middle line.
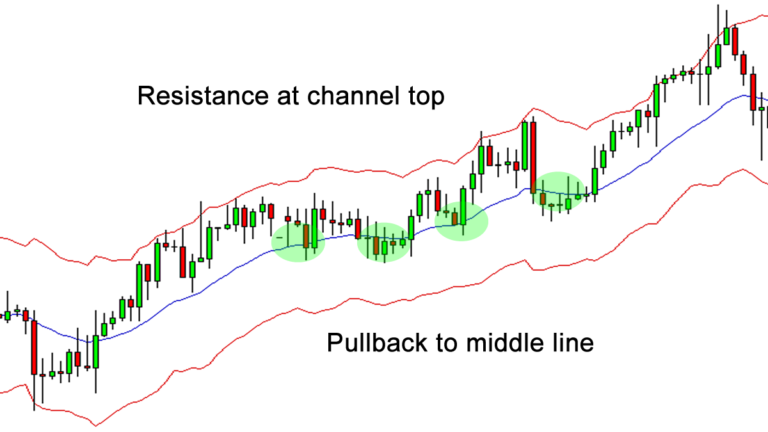
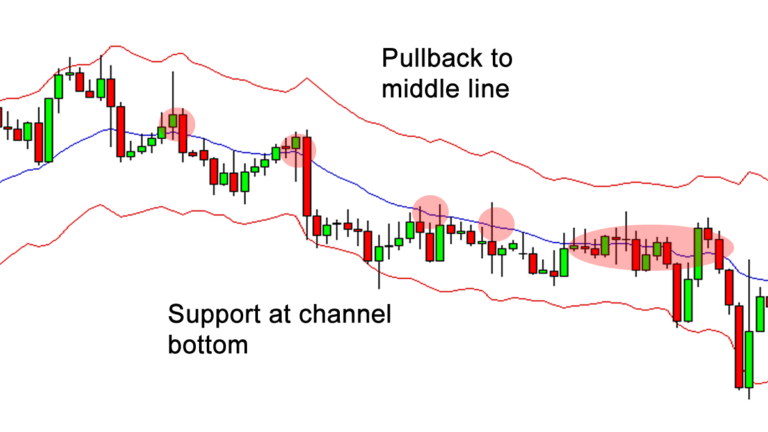
This middle line is crucial because it frequently serves as a pullback level during long-term trends.
The price activity in an UPTREND is confined to the UPPER HALF of the channel. This is located between the middle line as support and the top line as resistance.
Price activity in a downtrend normally stays in the bottom half of the channel. It stays with resistance at the middle line and support at the bottom line.
In a ranging market, the price generally swings back and forth between the top and bottom lines.
How to Trade Breakouts Using Keltner Channels
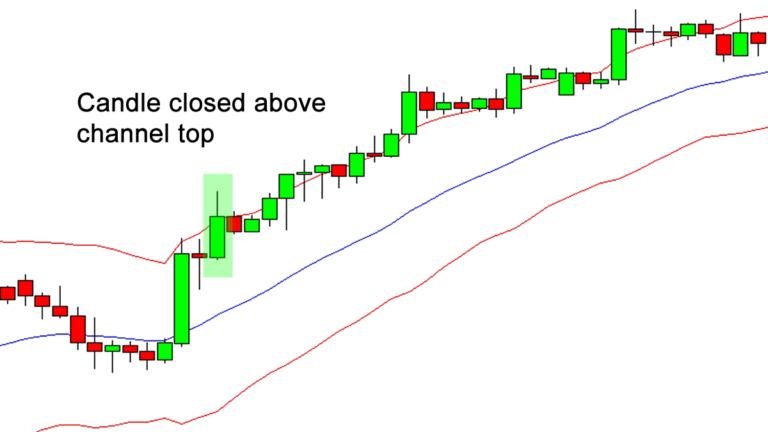
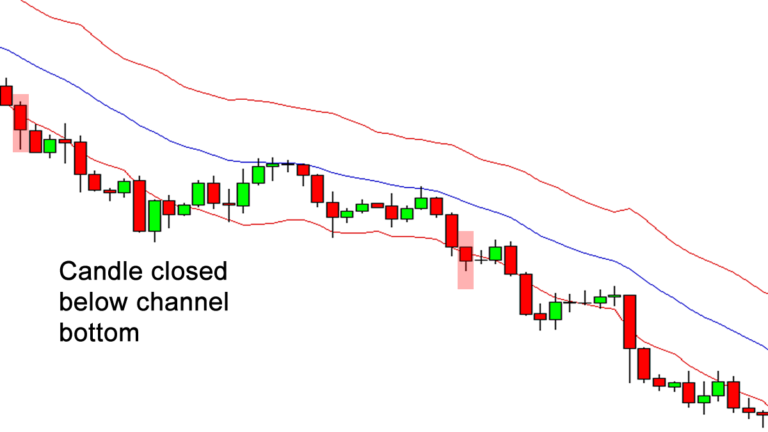
Breakouts from the Keltner Channel provide strong indicators of where the price is headed next.
If the candles begin to break out above the top, the trend is likely to continue upward.
If the candles begin to close below the BOTTOM, the price will almost always continue to fall.
Keeping a lookout for these channel breakouts might assist you in catching a major shift as soon as feasible.
Looking for a highly rated forex fund manager?
Fx Pips Guru has a strong group of forex experts. They manage the forex accounts of our clients from different brokers dedicatedly. Just hire our forex fund managers here : https://www.fxpipsguru.com/forex-fund-manager/