The foreign exchange market, or forex for short, is a dynamic beast, constantly churning with price movements. Gauging its direction and identifying potential entry and exit points can be a daunting task. This is where technical indicators come in, offering valuable insights to forex traders. Among these tools, the Relative Momentum Index (RMI) stands out as a variation of the popular RSI, aiming to provide a clearer picture of overbought and oversold conditions.
Delving into the RMI’s Origins and Core Concept
Developed by Roger Altman and introduced in 1993, the RMI takes inspiration from the Relative Strength Index (RSI). However, it introduces a key difference in its calculation method. While the RSI focuses on the average gains and losses relative to the previous closing price, the RMI takes a broader view. It considers the closing price today in relation to the closing price a specific number of days ago (denoted by “n”). This shift allows the RMI to potentially capture a stronger sense of momentum and trend direction.
Demystifying the RMI Calculation: A Step-by-Step Approach
Understanding the calculation behind the RMI empowers traders to interpret its signals effectively. Here’s a breakdown of the process:
- Define the Lookback Period: This refers to the number of days (“n”) used for comparison. A common choice is 14, similar to the RSI.
- Calculate Average Gains and Losses: Identify the price difference between the closing price today and the closing price “n” days ago. If the difference is positive, it’s considered a gain. If negative, it’s a loss. Now, calculate the average of these gains and losses over the chosen lookback period.
- Smoothing the Data (Optional): The RMI calculation can utilize a smoothing technique, often an Average True Range (ATR), to account for market volatility.
- Derive the RMI Value: The core formula involves dividing the average gain by the average loss (including smoothing if applied) and multiplying the result by 100. This generates an RMI value typically ranging between 0 and 100.
Important Note: The specific calculation methods and smoothing techniques might vary depending on the trading platform used.
Interpreting the RMI for Forex Trading Decisions
The RMI functions as an oscillator, with established zones for overbought and oversold conditions. Generally accepted levels are:
- Overbought: Values above 70 indicate the market might be overbought, suggesting a potential price pullback.
- Oversold: Values below 30 suggest the market might be oversold, hinting at a possible price reversal.
However, relying solely on these zones can be risky. Here’s how to leverage the RMI effectively:
- Confirmation with Price Action: Always observe the price movement alongside the RMI signal. An RMI reaching the overbought zone while the price continues to rise might indicate strong momentum, not necessarily an immediate reversal.
- Divergence: Look for divergences between the RMI and price action. For instance, a rising RMI alongside a falling price suggests weakening bullish momentum, potentially foreshadowing a reversal.
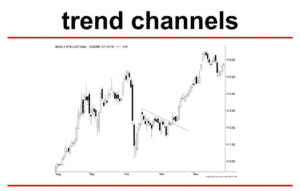
- Trend Considerations: The RMI’s effectiveness can be impacted by trends. In strong trends, the RMI might stay in overbought or oversold territory for extended periods.
Beyond the Basics: Advanced RMI Strategies for Forex Traders
Seasoned forex traders can explore more intricate applications of the RMI:
- Dynamic Thresholds: Instead of rigid overbought/oversold zones, consider adjusting these thresholds based on market volatility. During high volatility, expand the zones, and during low volatility, tighten them.
- Combining with Other Indicators: Integrate the RMI with other technical indicators like moving averages or MACD for additional confirmation of signals.
Cautions and Limitations of the RMI
While the RMI offers valuable insights, it’s crucial to acknowledge its limitations:
- False Signals: Overbought/oversold signals don’t guarantee immediate price reversals. The market can remain in these zones for extended periods.
- Indicator Dependence: Relying solely on the RMI can lead to missed opportunities. Integrate it with other forms of analysis, like fundamental factors, for a well-rounded approach.
- Overfitting: Backtesting the RMI on historical data can lead to overfitting, where the indicator appears more effective than it might be in real-time trading.
The RMI as a Forex Trading Ally
The Relative Momentum Index equips forex traders with a valuable tool to gauge market momentum and identify potential overbought/oversold conditions. By understanding its calculation, interpretation, and limitations, traders can incorporate the RMI into their trading strategies for more informed decision-making.
Let’s Manage Your Forex Funds With Fx Pips Guru!
Fx Pips Guru is a forex fund management company managing client’s funds based on equity size. Let’s do Live Chat with our experts.