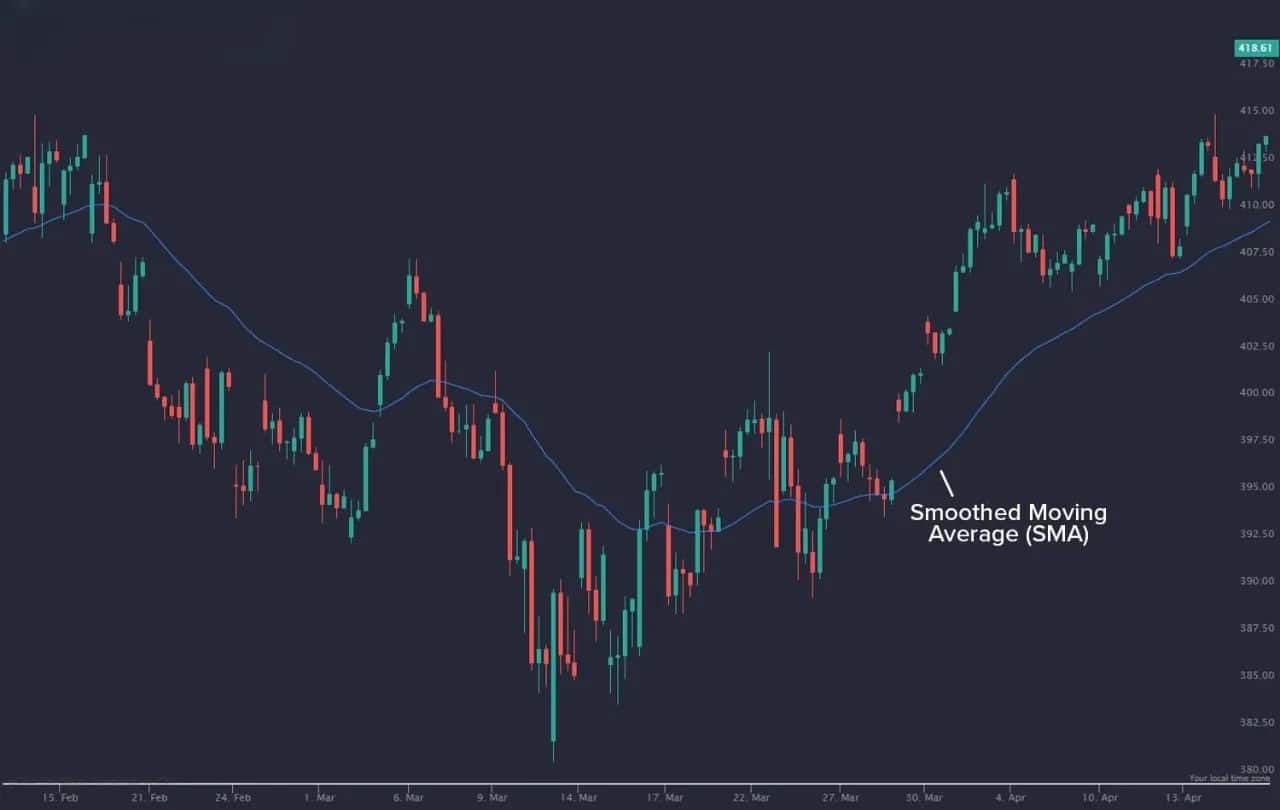
In the ever-churning world of financial markets, navigating price movements and identifying trends can be a daunting task. Here’s where technical analysis steps in, offering a toolbox of indicators to decipher market behavior. Among these tools, the Smoothed Moving Average (SMMA) stands out as a powerful technique for revealing underlying trends and filtering out short-term noise.
This comprehensive guide dives deep into the world of SMMAs, exploring its essence, calculation methods, applications in trading strategies, and its advantages and limitations.
Demystifying the SMMA: A Blend of Tradition and Innovation
The SMMA bridges the gap between two popular moving averages: the Simple Moving Average (SMA) and the Exponential Moving Average (EMA). The SMA calculates the average price over a defined period, assigning equal weight to each data point. This provides a basic understanding of the trend but can be overly sensitive to recent fluctuations.
On the other hand, the EMA places more emphasis on recent prices, giving them a higher weightage in the calculation. This helps in reacting quicker to price movements but might miss out on the broader trend if volatility is high.
The SMMA seeks to find a middle ground. It incorporates all available historical data points, similar to the SMA, but assigns diminishing weightage to older data as newer prices emerge. This approach smoothens out the price movements while still reflecting the underlying trend.
While there’s no universally agreed-upon formula for the SMMA, a common approach utilizes yesterday’s SMMA and the difference between today’s price and yesterday’s SMMA. This difference is then multiplied by a smoothing factor (often between 0.01 and 0.1) and added to yesterday’s SMMA to arrive at today’s SMMA.
Unveiling the Calculation: A Step-by-Step Guide
Let’s delve into the calculation process of the SMMA. Here’s a simplified breakdown:
- Establish the Smoothing Factor (α): This value determines the responsiveness of the SMMA to recent price changes. Lower values result in a smoother line, giving more weight to historical data, while higher values make the SMMA more reactive to recent price movements. A typical range for α is between 0.01 and 0.1.
- Initialize the SMMA: For the first calculation period, you can simply use the average price of the chosen timeframe (e.g., the average closing price for the past 20 days if using a 20-period SMMA).
- Calculate Subsequent SMMAs: Here’s the formula for calculating the SMMA for today (SMMA Today):
SMMA Today = α * (Today's Price - Yesterday's SMMA) + Yesterday's SMMA
Example:
Consider a stock with the following closing prices for the past 3 days:
- Day 1: $50
- Day 2: $52
- Day 3: $55
Let’s calculate the 3-day SMMA with a smoothing factor (α) of 0.1:
- Day 1: As we don’t have a previous SMMA, we’ll use the average price for Day 1 (SMMA Day 1) = $50
- Day 2: SMMA Day 2 = 0.1 * ($52 – $50) + $50 = $50.20
- Day 3: SMMA Day 3 = 0.1 * ($55 – $50.20) + $50.20 = $50.72
As you can see, the SMMA provides a smoother line compared to the raw closing prices, highlighting the underlying trend.
Embracing the Power of the SMMA: Applications in Trading
The SMMA serves multiple purposes in a trader’s arsenal:
- Trend Identification: By smoothing out price fluctuations, the SMMA helps visualize the overall trend direction, whether uptrend, downtrend, or sideways consolidation.
- Support and Resistance Levels: The SMMA can act as a dynamic support level in uptrends and a resistance level in downtrends. Price movements often tend to find support or resistance around the SMMA line.
- Trading Signals: Crossovers between the SMMA and other moving averages (like the SMA or another SMMA with a different period) can generate potential buy or sell signals. For instance, a shorter-period SMMA crossing above a longer-period SMMA might indicate a bullish signal.
- Filtering Market Noise: The SMMA’s ability to smooth out short-term volatility helps traders focus on the bigger picture and avoid making impulsive decisions based on minor price swings.
However, it’s crucial to remember that the SMMA is not a foolproof indicator. Here are some limitations to consider:
- Lag: Like other moving averages, the SMMA inherently lags behind price movements. This means it might not capture extremely volatile price swings or sudden trend reversals.
- Choice of Smoothing Factor: The selection of the smoothing factor (α) significantly impacts the responsiveness of the SMMA. A lower α results in a smoother line but might be too slow to react to changing trends. Conversely, a higher α makes the SMMA more reactive but might lead to excessive noise and false signals. Experimentation and backtesting are essential to find the optimal α for your specific trading strategy and market conditions.
- False Signals: Crossovers between the SMMA and other indicators can generate false signals, especially during periods of high volatility or market consolidation. Combining the SMMA with other technical analysis tools can help improve signal accuracy.
Optimizing Your Trading with the SMMA: Key Considerations
Here are some key pointers to leverage the SMMA effectively in your trading:
- Match the SMMA to Your Trading Style: Day traders might benefit from shorter-period SMMAs (e.g., 10-day) to capture short-term trends, while swing traders might prefer longer periods (e.g., 50-day) to focus on more established trends.
- Combine with Other Indicators: Don’t rely solely on the SMMA. Use it in conjunction with other technical indicators like volume analysis, MACD, or RSI to confirm signals and gain a more comprehensive view of the market.
- Backtesting is Crucial: Before deploying the SMMA in live trading, backtest it on historical data to assess its performance and identify potential limitations.
Beyond Trading: The Broader Applications of SMMA
The SMMA’s utility extends beyond the realm of financial markets. It finds applications in various fields where analyzing trends and filtering out noise is crucial. Here are a few examples:
- Sales Forecasting: Businesses can utilize the SMMA to analyze historical sales data and predict future sales trends. This helps with inventory management, resource allocation, and budgeting.
- Website Traffic Analysis: Website owners can leverage the SMMA to understand website traffic patterns and identify periods of peak activity. This information can be used to optimize website content and marketing campaigns.
- Project Management: Project managers can employ the SMMA to track project progress and identify potential delays or bottlenecks. This allows for proactive adjustments and ensures projects stay on schedule.
The Smoothed Moving Average stands as a valuable tool for discerning trends and mitigating short-term market noise. By understanding its calculation, applications, and limitations, traders and analysts across various fields can leverage the SMMA to make informed decisions and navigate the ever-changing landscape of data. Remember, the SMMA is just one piece of the puzzle, and combining it with other techniques and a healthy dose of critical thinking is key to success.
Let’s Manage Your Forex Funds With Fx Pips Guru!
Fx Pips Guru is a forex fund management company managing client’s funds based on monthly profit share. Let’s do Live Chat with our experts.