Trendlines are a cornerstone of technical analysis in the forex market. By visually connecting price points on a chart, they offer a simple yet powerful tool to identify trends, gauge support and resistance levels, and potentially predict future price movements. However, simply drawing a line on a chart isn’t enough. To harness the true potential of trendlines, forex traders need to understand how to effectively use them within their overall trading strategy.
Unveiling the Trend: The Power of Trendline Identification
The primary function of trendlines lies in their ability to reveal the underlying trend direction. There are two main trendline types:
- Upward Trendline: This line connects a series of higher lows, indicating a bullish market where buyers are in control.
- Downward Trendline: This line connects a series of lower highs, suggesting a bearish market where sellers dominate.
Drawing a valid trendline requires at least two significant highs (uptrend) or lows (downtrend). However, for better confirmation, three or more data points are ideal. The steeper the trendline, the less reliable it becomes, as extreme price movements are generally unsustainable.
Here are some key considerations when drawing trendlines:
- Focus on price action: The line should touch or come close to multiple highs or lows, not deviate significantly.
- Maintain objectivity: Avoid forcing a line to fit a desired outcome. Let the price action dictate the trendline’s direction.
- Dynamic adjustments: Trends evolve. Be prepared to adjust the trendline as prices create new highs or lows.
Support and Resistance: Trendlines as Price Boundaries

Trendlines not only reveal the trend but also act as dynamic support and resistance levels.
- Support in Uptrends: The upward trendline functions as a support level, potentially preventing prices from falling below it. When the price approaches the trendline from above, it might indicate a buying opportunity as the market may bounce back up.
- Resistance in Downtrends: The downward trendline acts as a resistance level, potentially capping price increases. A price approaching the trendline from below might signal a selling opportunity as the market may be rejected and fall back down.
The strength of these support and resistance levels is determined by several factors:
- Number of Touches: The more times the price tests the trendline without breaking through, the stronger the support/resistance becomes.
- Volatility: During periods of high volatility, prices might pierce the trendline more frequently, weakening its significance.
- Timeframe: Trendlines drawn on longer timeframes tend to hold more weight compared to those on shorter timeframes.
Beyond the Lines: Trendlines and Trend Reversals
While trendlines excel at identifying established trends, they can also provide clues about potential trend reversals.
- Trendline Breaks: A clean break below an uptrend line or above a downtrend line signifies a potential trend reversal. However, false breakouts can occur, so confirmation with other technical indicators is crucial.
- Price Action at the Trendline: Observe how price reacts upon touching the trendline. Doji candlesticks or indecision candles near the line might indicate a struggle between buyers and sellers, hinting at a possible trend change.
Remember, trendlines are not absolute guarantees of future price movements. They should be used in conjunction with other technical analysis tools like:
- Moving Averages: Moving averages can help confirm the overall trend direction and identify potential support/resistance zones.
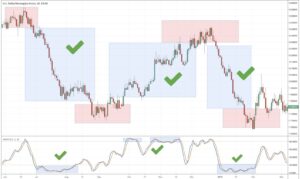
- Oscillators: Oscillators like the Relative Strength Index (RSI) can indicate overbought or oversold conditions, potentially foreshadowing a trend reversal near support/resistance levels identified by trendlines.
- Volume: Higher volume often accompanies valid trend breaks, adding confirmation to the potential trend reversal signal.
Implementing Trendlines into Your Forex Trading Strategy
By incorporating trendlines into your trading strategy, you can make more informed decisions:
- Identify Entry and Exit Points: Look for buying opportunities near support levels (uptrend lines) and selling opportunities near resistance levels (downtrend lines).
- Manage Risk: Use trendlines to place stop-loss orders below support in uptrends and above resistance in downtrends, limiting potential losses if the trend breaks against your position.
- Confirm Other Indicators: Use trendlines alongside other technical indicators to strengthen trading signals and filter out false positives.
Here are some additional tips for effective trendline usage:
- Practice on Demo Accounts: Before risking real capital, hone your trendline drawing skills and experiment with different strategies on a demo account.
- Beware of Overreliance: No single indicator is foolproof. Use trendlines as a guide, not a guaranteed prediction tool.
- Market Context Matters: Consider economic news events and fundamental factors that can significantly impact currency pairs and potentially invalidate trendline signals.
Let’s Manage Your Forex Funds With Fx Pips Guru!
Fx Pips Guru is a forex fund management company managing client’s funds based on monthly profit share. Let’s do Live Chat with our experts.