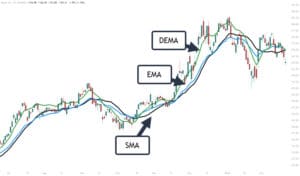
Moving averages can also be used to create dynamic support and resistance levels.
Because it’s not like standard horizontal support and resistance lines, we call it dynamic. They are continually shifting in response to recent price movements.
Many forex traders consider these moving averages to be important levels of support or resistance. When the price drops and tests the moving average, these traders will buy, and when the price rises and touches the moving average, they will sell.
Let’s take a look at the GBP/USD 15-minute chart and put the 50 EMA on it. Let’s see if it acts as dynamic resistance or support.
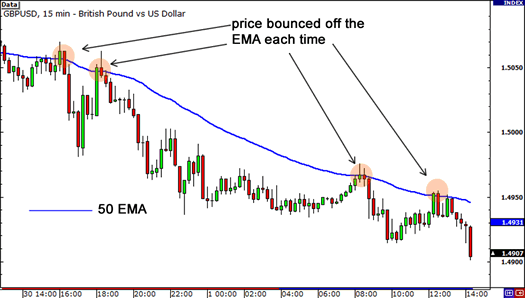
It appears to have held up really nicely! When the price approached and tested the 50 EMA, it functioned as resistance, and the price dropped. Isn’t it incredible?
It’s important to remember that these are just like your standard support and resistance lines.
This means that pricing does not always follow the moving average completely.
It will occasionally go past it for a brief moment before returning to the trend.
There are also situations when the price will completely surpass it. Some forex traders use two moving averages and only buy or sell when the price is in the middle of the gap between the two.
This area could be referred to as “the zone.”
Let’s take another look at that 15-minute chart of GBP/USD, but this time let’s use the 10 and 20 EMAs.

From the chart above, you see that price went slightly past the 10 EMA a few pips but proceeded to drop afterward.
Some traders utilize intraday tactics that are similar to this.
The notion is that these moving averages, like your horizontal support and resistance areas, should be considered as zones or areas of interest.
The space between moving averages can be viewed as a support or resistance zone.
Breaking through Dynamic Support and Resistance
Moving averages might potentially operate as support and resistance, as you now know. You can make a lovely little zone by combining a few of them.
However, much like every other support and resistance level, they can be broken!
Let’s take another look at the 50 EMA on the 15-minute GBP/USD chart.

The 50 EMA held as a powerful resistance level for a time in the chart above, as GBP/USD frequently bounced off it.
However, as seen by the red box, the price finally broke through and increased.
After that, the price retraced and tested the 50 EMA once again, which proved to be a solid support level.
That’s all there is to it, guys!
The line most likely symbolizes a shifting region of interest, as you well know. The main issue is determining which moving average to employ!
Looking for a highly rated forex fund manager?
Fx Pips Guru has a strong group of forex experts who are managing forex accounts of our clients from different brokers dedicatedly. Just hire our forex fund managers here: https://www.fxpipsguru.com/forex-fund-manager/.