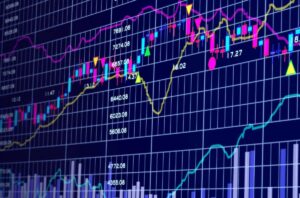
One of the most widely utilized technical indicators is moving averages.
A moving average is merely a way to smooth out price swings so you can tell the difference between market “noise” and the true trend direction.
We use the term “moving average” to describe taking the average closing price of a currency pair over the last “X” number of periods.
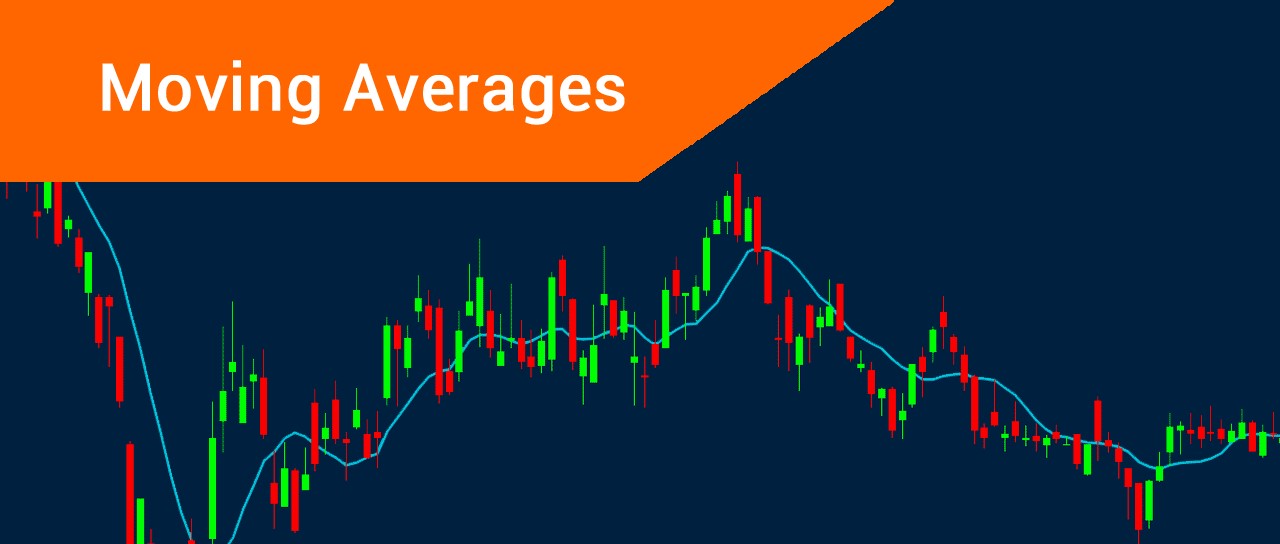
It might appear like this on a graph:
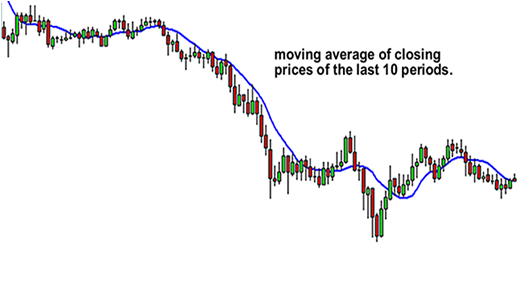
It appears as a squiggly line on top of the price, as you can see.
A “chart overlay” is to describe this type of technical indicator.
On the price chart, you will get the moving averages (MA)! Do you see what I mean?
They use the MA indicator to forecast future prices.
Why not simply glance at the pricing to see what’s going on?
The reason for utilizing a moving average rather than merely looking at the price is that aside from Santa Clause not being real, trends do not move in straight lines in the actual world.
Because price zigzags and zags, a moving average smooths out the fluctuations and allows you to “see” the underlying trend.

The smoother the average, the slower it reacts to price changes in general.
The faster the moving averages react to price fluctuation, the choppier it is.
You should get the average closing prices over a longer time period to make a moving average smoother.
How to Choose the Proper “Length” of Moving Averages
The number of reporting periods used to calculate the MA has an impact on how the moving average is shown on a price chart.
The fewer data points that are included in the MA calculation, the closer the moving average keeps to the current price, the shorter its “length.”
This limits its use and may provide less information about the overall trend than the present price.
The longer it is, the more data points are incorporated in the moving average calculation, implying that every single price has a smaller impact on the overall average.
Price fluctuations may become “too smooth” if there are too many data points. And you won’t be able to discern any kind of trend!
In any case, determining whether price direction will alter in the near future might be challenging. As a result, it’s critical to choose a length. Because that delivers the optimum amount of price data for your trading timeframe.
“Come on, let’s get to the fun stuff,” you’re presumably thinking. What can I do with this?”
First, we’ll go through the two main forms of moving averages in this section:
- Simple
- Exponential
We’ll also show you how to calculate them and explain the advantages and disadvantages of each. Like every other lesson in fxpipsguru.com, you must first master the fundamentals!
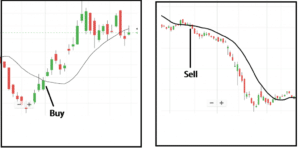
We’ll teach you the numerous ways to use moving averages and how to incorporate them into your trading strategy. Once you’ve got that down, like Argentinian soccer player Lionel Messi’s ball-handling skills.
You’ll be as silky as Messi’s by the conclusion of this session!
Remember that moving averages smooth price data to generate a trend-following technical signal before moving on.
They do not predict price direction; rather, they use a lag to identify the current direction.
Looking for a highly rated forex fund manager?
Fx Pips Guru has a strong group of forex experts. They manage the forex accounts of our clients from different brokers dedicatedly. Just hire our forex fund managers here: https://www.fxpipsguru.com/forex-fund-manager/.