We’ve been looking at technical indicators that mostly focus on detecting the start of new trends up until now. The Parabolic SAR is a technical indicator to determine the direction that an asset is moving.
It is critical to be able to recognize new trends, but it is also critical to be able to recognize when a trend has reached its end.
After all, what good is a well-timed entry if you don’t exit on time?
The parabolic SAR is one indicator that can assist us to detect when a trend is about to terminate (Stop And Reversal).
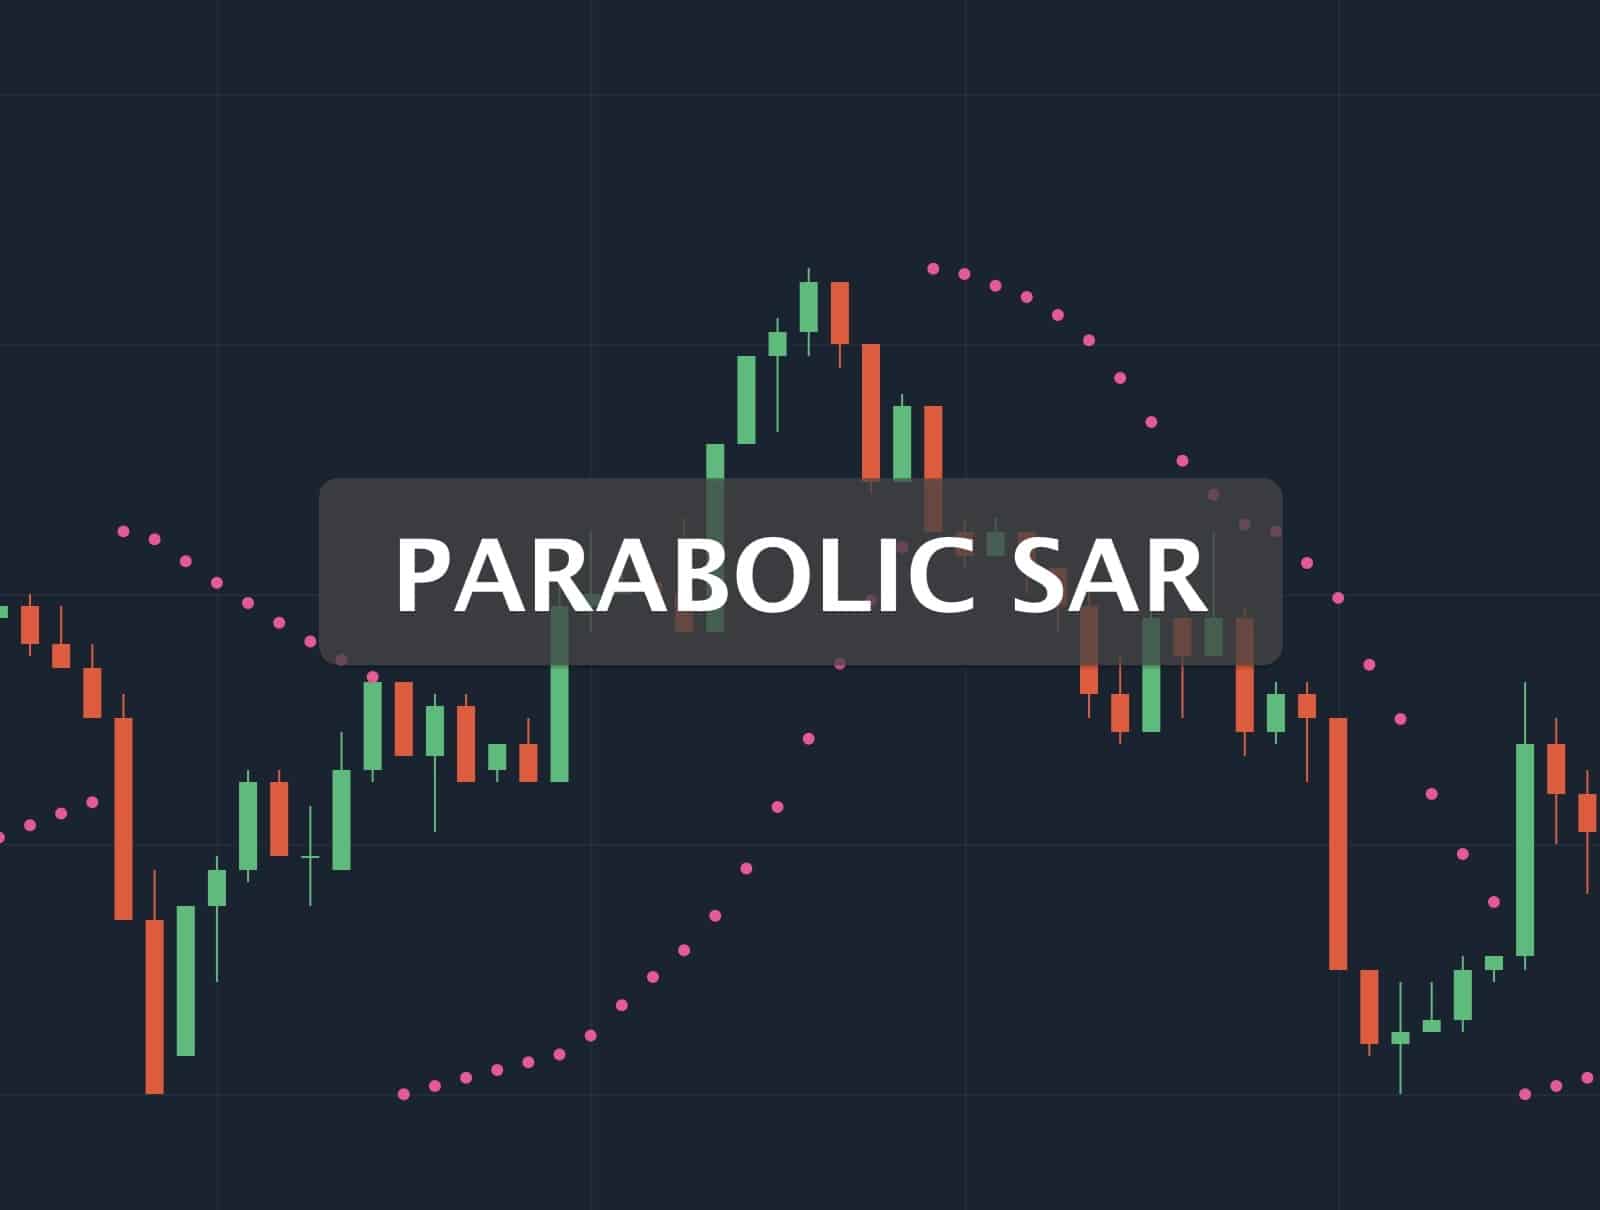
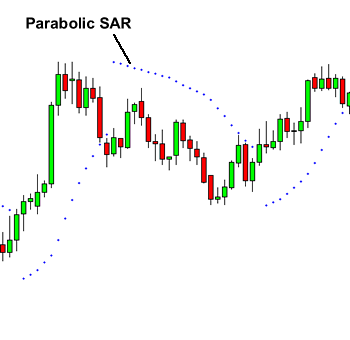
A parabolic SAR plots dots or points on a chart to indicate possible price movement reversals.
The dots transition from being below the candles during an uptrend to being above the candles when the trend reverses into a downtrend, as shown in the image above.
How to Trade Using Parabolic SAR
The Parabolic SAR has the advantage of being quite simple to operate. We mean REALLY easy!
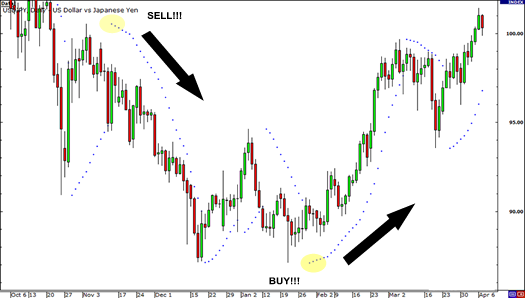
Basically, it’s a BUY signal when the dots are below the candles.
It’s a SELL indicator when the dots are above the candles.
Simple?
Yes, we were thinking the same thing.
Because it presupposes that the price is either moving up or down, this is perhaps the easiest signal to read. As a result, this tool works best in markets that are trending and have protracted rallies and declines.
In a turbulent market with sideways price movement, you DO NOT want to use this tool.
How to use Parabolic SAR to exit trades
Parabolic SAR can also be used to help you decide whether or not to close a transaction.
On the daily chart of EUR/USD, see how the parabolic SAR functioned as an exit signal.
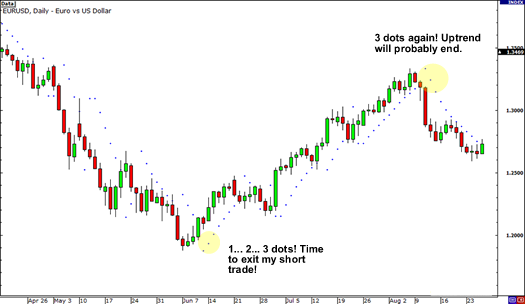
When the EUR/USD began to fall in late April, it appeared like it would continue to fall like a rock.
A trader who was successful in shorting this pair may have pondered how low it could go.
Three dots occurred near the bottom of the price in early June, indicating that the downtrend had ended and it was time to exit those shorts.
If you held on to that trade in the hope that the EUR/USD would continue to fall, you would have lost all of your profits because the pair eventually climbed back to about 1.3500.
Looking for a highly rated forex fund manager?
Fx Pips Guru has a strong group of forex experts who are managing forex accounts of our clients from different brokers dedicatedly. Just hire our forex fund managers here: https://www.fxpipsguru.com/forex-fund-manager/.