The foreign exchange market, also known as forex, is a dynamic and ever-changing beast. Identifying trends and potential shifts in direction is crucial for success in this fast-paced environment. Trend reversal patterns offer valuable clues to traders, helping them anticipate when a prevailing trend might be nearing its end and a new one on the horizon.
This article delves into the world of trend reversal patterns in forex trading, exploring how they can be used to inform trading decisions and potentially generate profits.
Understanding Trend Reversals
A trend reversal signifies a shift in the dominant direction of a currency pair’s price movement. In simpler terms, an uptrend reversal suggests a price decline after a period of sustained increase, while a downtrend reversal indicates a potential rise following a consistent price fall.
These reversals don’t happen instantaneously. Often, they are preceded by periods of consolidation or retracement, where the price fluctuates within a specific range before breaking out in the opposite direction.
The Power of Price Action: Candlestick Patterns
Forex traders heavily rely on technical analysis, and candlestick charts are a cornerstone of this approach. Candlestick patterns are visual representations of price movements over a specific time frame, typically a day, week, or month. The body of the candlestick reflects the opening and closing prices, while the wicks (or shadows) illustrate the highs and lows.
Several candlestick patterns are specifically designed to identify potential trend reversals. Here are some of the most common ones:
Hammer: This bullish reversal pattern features a small body and a long wick extending downwards. It suggests that sellers initially pushed the price down, but buyers emerged, driving the price back up significantly.
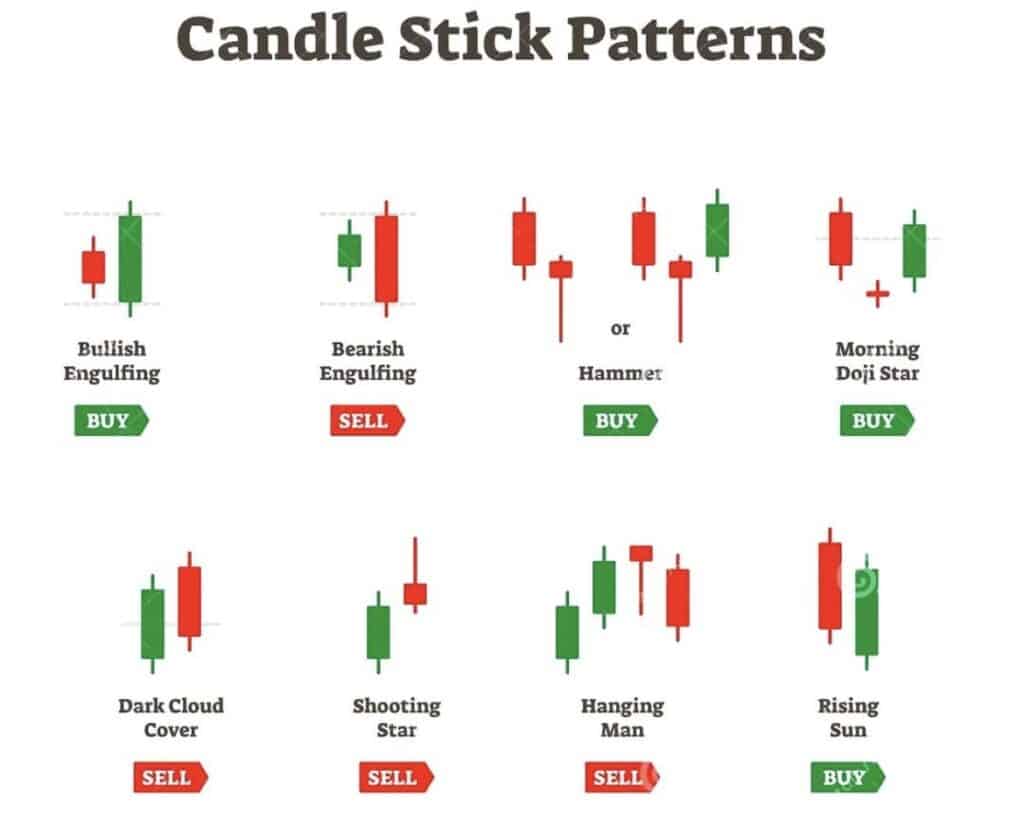
Inverted Hammer: Similar to the hammer, but appearing at the top of an uptrend, the inverted hammer indicates a potential bearish reversal. A long wick extends upwards, signifying buying pressure that was eventually overcome by sellers.
Engulfing Pattern: This two-candlestick pattern consists of a large candlestick that entirely “engulfs” the body of the previous candlestick in the opposite direction. A bullish engulfing pattern with a large green candle following a small red candle suggests a potential uptrend reversal, and vice versa for a bearish engulfing pattern.
Doji: A Doji is a single candlestick with a very small body, indicating that the opening and closing prices are nearly equal. While not a definitive reversal pattern, a Doji with long wicks appearing at the end of a trend can signal indecision and a potential turning point.
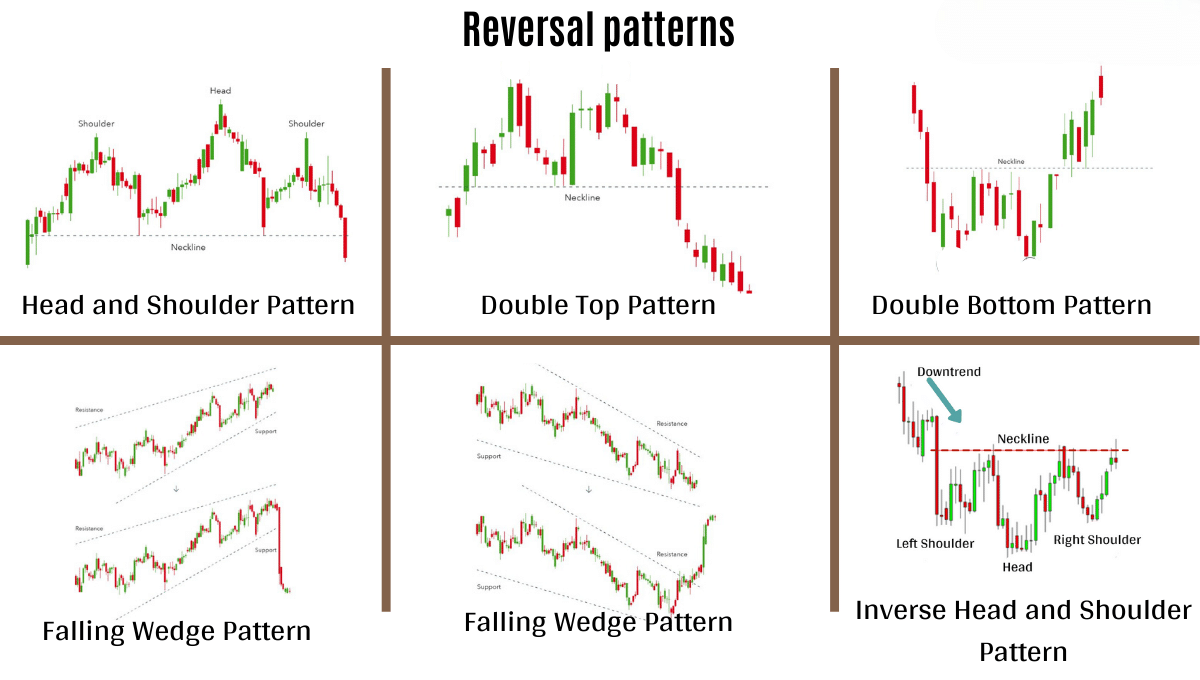
Head and Shoulders (H&S): This prominent bearish reversal pattern resembles a human head with two shoulders. It consists of three peaks, with the middle peak (the head) being the highest, and the two outer peaks (the shoulders) being roughly similar in height. A neckline is drawn connecting the lows of the troughs between the peaks. A break below the neckline signifies a potential downtrend reversal.
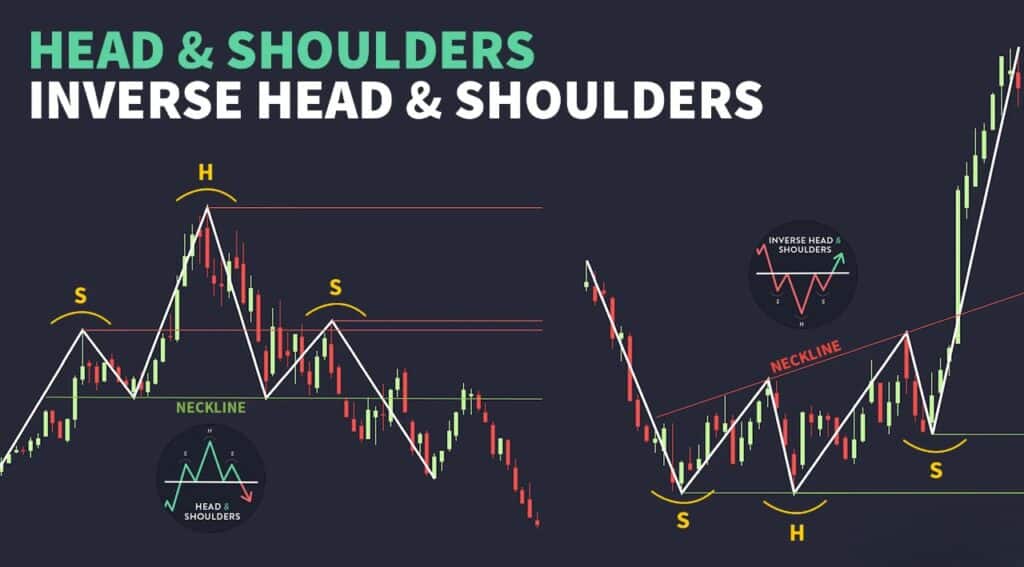
Inverse Head and Shoulders (IHS): The inverse counterpart of the H&S pattern, the IHS is a bullish reversal pattern. It features three troughs with the middle trough being the lowest, and a neckline connecting the highs of the shoulders. A break above the neckline suggests a potential uptrend reversal.
Important Considerations:
- Confirmation: While these patterns offer valuable insights, they shouldn’t be treated as absolute signals. Confirmation from other technical indicators like moving averages or volume analysis can strengthen the reversal possibility.
- Context Matters: The location of the reversal pattern within the broader trend and the overall market sentiment are crucial factors. A reversal pattern at the end of a well-established trend carries more weight than one appearing during a period of consolidation.
- False Signals: No indicator is foolproof, and trend reversals can be deceptive. Sometimes, these patterns might not lead to a true reversal, resulting in false signals.
Beyond Candlesticks: Additional Tools for Reversal Identification
While candlestick patterns are a powerful tool, forex traders can utilize other technical indicators in conjunction with them to bolster their decision-making:
- Support and Resistance Levels: Identifying historical support and resistance levels on the chart can provide clues about potential reversal points. A sustained break above resistance might signal a bullish reversal, while a break below support could indicate a bearish reversal.
- Moving Averages: Moving averages smooth out price fluctuations and help identify the prevailing trend. A price crossing above a long-term moving average can suggest a bullish reversal, while a price crossing below might indicate a bearish reversal.
- Volume Analysis: A surge in trading volume often accompanies significant trend reversals. Higher volume alongside a reversal pattern strengthens the possibility of a true trend shift.
- Stochastic Oscillator and Relative Strength Index (RSI): These oscillators measure price momentum and identify potential overbought or oversold conditions. When the RSI or Stochastic reaches extreme highs (overbought) following an uptrend, it might suggest a potential reversal to the downside. Conversely, reaching extreme lows (oversold) during a downtrend could signal a potential bullish reversal.
Putting it All Together: Developing a Trading Strategy
By combining trend reversal patterns, technical indicators, and sound risk management practices, forex traders can develop a comprehensive strategy for identifying potential trend reversals. Here’s a possible roadmap:
- Identify the Trend: Analyze the forex pair’s historical price movement to understand the prevailing trend (upward, downward, or sideways consolidation).
- Spot Reversal Patterns: Look for candlestick reversal patterns appearing at the end of the established trend.
- Confirmation with Indicators: Analyze support/resistance levels, moving averages, volume patterns, or momentum oscillators to confirm the potential reversal.
- Risk Management: Before entering a trade based on a reversal signal, establish clear stop-loss and take-profit levels to manage risk and protect your capital.
- Adapt and Learn: The forex market is dynamic, and no strategy is foolproof. Continuously monitor your trades, learn from your experiences, and adapt your approach based on market conditions.
By understanding trend reversal patterns and incorporating them into a well-rounded trading strategy, forex traders can potentially improve their decision-making and navigate the ever-changing currency market with greater confidence.
Let’s Manage Your Forex Funds With Fx Pips Guru!
Fx Pips Guru is a forex fund management company managing client’s funds based on monthly profit share. Let’s do Live Chat with our experts.