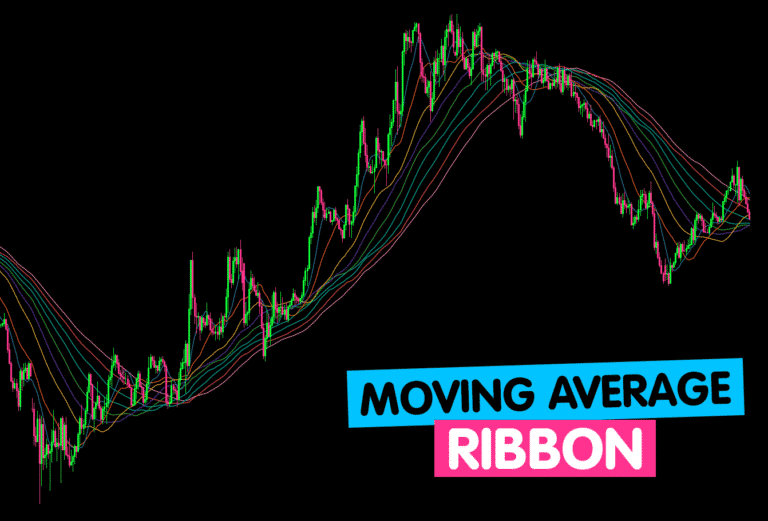
What is the meaning of a moving average ribbon?
A moving average ribbon is a chart with a sequence of moving averages of various lengths.
The main notion behind “moving average ribbons” is that instead of using one or two moving averages on a chart, you use a number of them, usually between 6 and 16 moving averages (or more).
They’re all on the same graph.
Consider the following scenario…

Traders can use the smoothness of the ribbon to gauge the strength of a trend, as well as the price in relation to the ribbon to identify critical points of support or resistance.
How to Set Up a Moving Average Ribbon
“How many moving averages do I use?” is a popular question.
It is entirely up to the merchant.
Six to eight simple moving averages (SMAs) set at 10-period intervals, such as the 10, 20, 30, 40, 50, and 60-day SMAs, are popular among traders.
Others prefer to use SIXTEEN (or more) simple moving averages, ranging from 50 days to 200 days and everything in between.
The use of longer-term MAs is justified on the grounds that it provides a more accurate picture of the overall trend.
Other traders, on the other hand, prefer to utilize exponential moving averages rather than simple moving averages.
As a result, everything comes down to personal preference.
The moving average ribbon’s responsiveness can be tweaked by:
- Increasing or decreasing the amount of time periods in the moving average
- Changing from a simple moving average (SMA) to an exponential moving average (EMA)
The fewer the periods used when deciding which MAs to include in the chart, the more sensitive the moving average ribbon is to price fluctuations.
Moving averages with a higher period count (such as 200) are less sensitive and smoother.
How to Trade with Moving Average Ribbons
- An EXPANDING moving average ribbon signals the potential end of a trend
When the moving averages begin to widen and separate, also known as ribbon “expansion,” it indicates that the current price movement has reached an extreme and that the trend may be coming to an end.
Consider each moving average to be a magnet that attracts the others.
They don’t want to be separated for long periods of time. As a result, when they are, they will want to close the gap.
- A CONTRACTING moving average ribbon signals a possible change in trend
A trend change may have begun when the moving averages begin to converge and get closer to one other, also known as ribbon “contraction.”
Shorter-term moving averages will converge first after an enormous price move in one direction. Longer moving averages will gradually converge.
- A PARALLEL moving average ribbon signals a strong trend.
This indicates that the present trend is strong when the moving average ribbons are parallel and equally spaced.
Because all of the moving averages are heading in the same direction, they are in “accord.”
Keep an Eye on the Spacing Between the Moving Averages
Some traders make the mistake of simply watching the moving averages when they “cross over” or “twist.”
While it’s critical to keep an eye on when short-term moving averages cross above (or below) long-term moving averages, it’s also crucial to keep an eye on the SPACING between them.
The DIRECTION of the trend is shown by the positioning of short-term moving averages in relation to long-term moving averages (down, neutral, up).
The distance between the moving averages indicates the trend’s STRENGTH (weak, neutral, strong).
Moving Average Ribbon Example
On a 1-hour chart, let’s look at a moving average ribbon applied to GBP/USD.
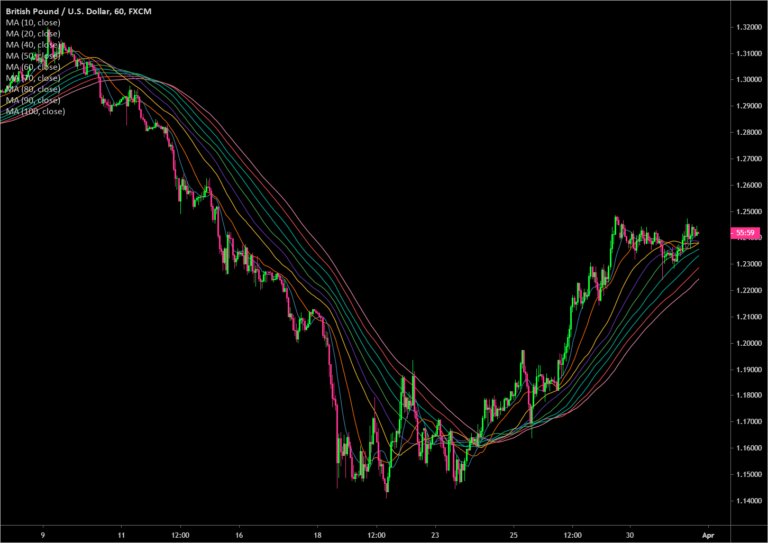
Can you see the trend changes?

When the moving averages start to cross over or “twist” lower or upwards, you can readily detect bullish or bearish trends in the chart above.
The widening of the space between the moving averages, known as ribbon expansion, indicates the end of the current trend.
The shortening of the space between the moving averages, or ribbon contraction, indicates the onset of a new trend.
Looking for a highly rated forex fund manager?
Fx Pips Guru has a strong group of forex experts who are managing forex accounts of our clients from different brokers dedicatedly. Just hire our forex fund managers here : https://www.fxpipsguru.com/forex-fund-manager/.