The Guppy Multiple Moving Average (GMMA) indicator uses moving average ribbons to provide an innovative approach.
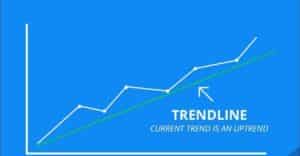
It’s not enough to just recognize a trend‘s direction and catch it as a trend trader.
Trend trading success is contingent not only on correctly recognizing the trend direction and catching the trend once it has begun but also on exiting as soon as the trend has reversed.
If you’re having trouble with any of the above, you should check out the Guppy Multiple Moving Average indicators.
The Guppy Multiple Moving Average (GMMA), often known as “Guppy,” is a technical indicator that detects changes in trends, allowing you to know when to enter and exit a trade objectively.
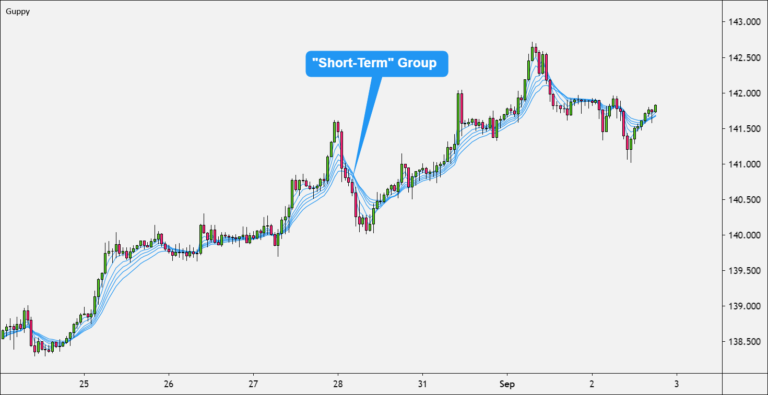
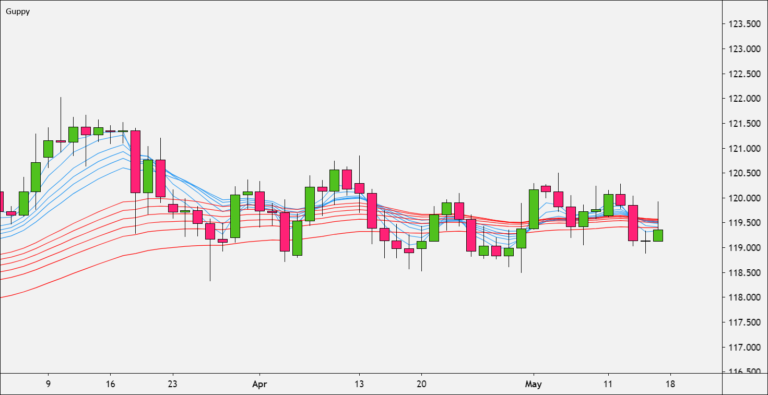
This is what it looks like on a graph…

The Guppy was invented by Daryl Guppy, an Australian businessman. As a result, the indicator’s name.
In his book, Trend Trading, Daryl introduced GMMA.
The Guppy is a trend-following strategy made out of 12 exponential moving averages (EMAs) (or exponential moving averages).
Guppy’s many lines make it easier for traders to see the strength or weakness of a trend than if they only used one (or two) EMAs.
EMAs Categories
The 12 EMAs are divided into two categories:
- A set of EMAs with a “short-term” focus.
- A category of EMAs with a “long-term” focus.
There are six MAs in each group.

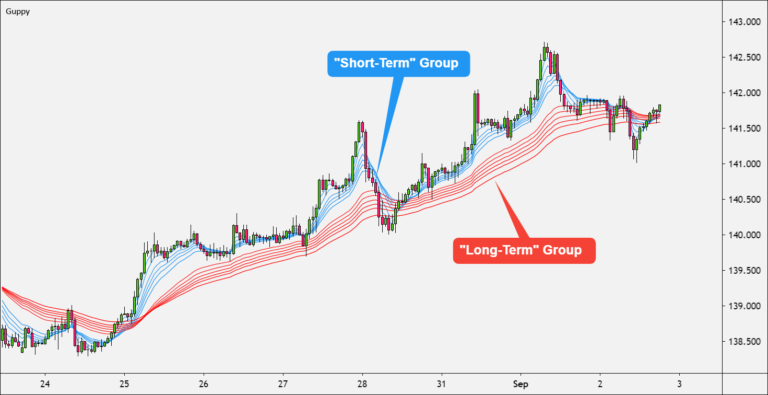
The two groups of EMA are distinguished by color in the graph above.
The “short-term” group is represented by blue, while the “long-term” group is represented by red.
The long-term EMAs dictate the trend, whereas the short-term EMAs provide signals.
When a trend reversal happens, which is indicated when one group crosses over the other, you would enter a trade.
BUY when the short-term group passes the longer-term group.
SELL when the shorter-term group falls below the longer-term group.
How to Set Up the Guppy Multiple Moving Average
TWO groups of exponential moving averages (EMAs) with different time periods are combined in this technique (or lengths).
3, 5, 8, 10, 12, 15, 30, 35, 40, 45, 50, and 60 are the twelve periods used.
The 3, 5, 8, 10, 12, and 15 EMAs are used to depict the momentum of a short-term trend.
The longer-term trend’s momentum is represented by the 30, 35, 40, 45, 50, and 60 EMAs.

Now, on the chart, we’ll show both groupings of EMAs.
With these two groups of EMAs, trend reversals and continuations can be detected.
How to Use the Guppy Multiple Moving Average
The Guppy Multiple Moving Average can be used to spot changes in trend direction or assess the existing trend’s strength.
How to Identify Trend Strength
The distance between the short- and long-term moving averages can be used to determine the strength of a trend.
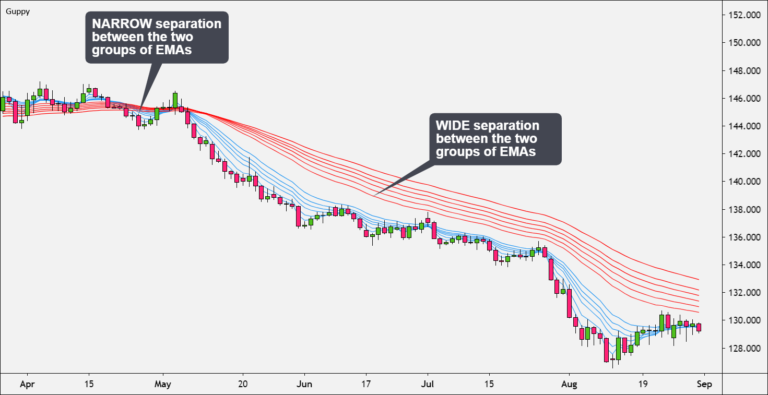
If there is a LARGE gap, the prevailing tendency is likely to be strong.
If the lines are intertwined or there is a NARROW separation, it signals a weakening trend or a period of consolidation.
How to Identify Trend Reversals
Trend reversals are represented by the crossover of the short- and long-term moving averages.

A bullish crossing occurs when the short-term EMAs cross ABOVE the long-term moving averages, indicating that a bullish reversal has occurred.
A bearish crossover occurs when the short-term EMAs cross BELOW the longer-term ones, indicating that a bearish reversal is underway.
How to Identify a Lack of Trend
When the moving averages of the two groups are almost parallel and close together. It means that the short-term market sentiment and long-term trend are substantially in agreement.
When both groups of EMAs are moving horizontally, the price is said to be trendless.
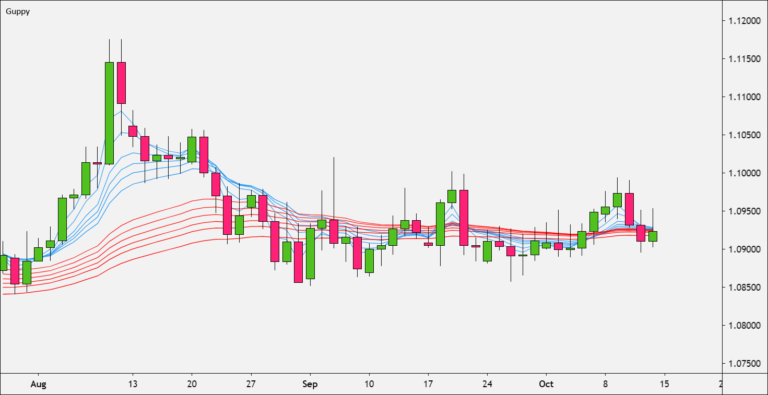
When the red and blue groups of EMAs are interlaced, just go up and down within a range, as shown in the chart above.
This price action is better suited to range trading. It would make sense for a trend trader to sit out and wait for better conditions.
“When the market is sideways, trend traders sit on the sidelines,” as the saying goes.
How to Trade Currencies with the Guppy Multiple Moving Average
The GMMA indicator can be used for trade signals.
Buy Signals
A fresh bullish trend is verified when all short-term EMAs cross above all long-term EMAs, triggering a buy signal.
When the short-term MAs move back toward the longer-term MAs, but do not cross, and then begin to move higher during a strong uptrend, this implies another continuation of the bullish trend and triggers a buy signal.
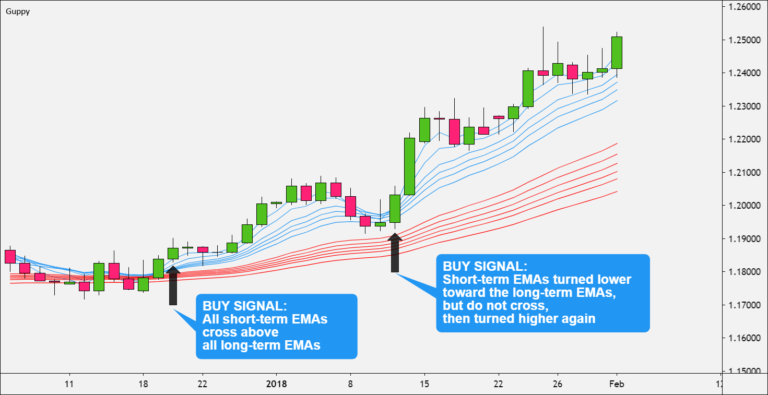
If prices fall back after a crossover and then bounce off the longer-term EMAs, this indicates a continuation of the bullish trend and triggers a buy signal.
Sell Signals
When all short-term EMAs cross below all long-term EMAs, a new negative trend is signaled, and a sell signal is issued.
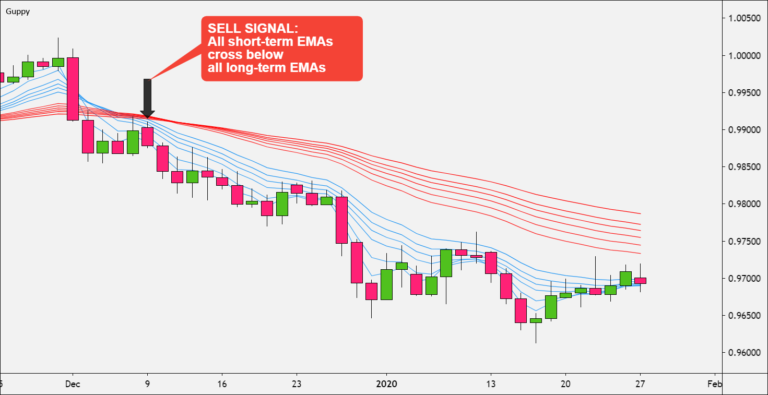
When the short-term MAs move back toward the longer-term MAs, but do not cross, and then begin to move lower during a strong downturn, this implies a continuation of the negative trend and initiates a sell signal.
Also, after a bearish crossover, if the price rises but then bounces off from the long-term EMAs, this signals a continuation of the bearish trend and triggers a sell signal.
No Signal
When the price and the EMAs are going laterally, the buy and sell indications above should be avoided.
Wait for a crossover and separation after a consolidation phase.
This indicator will not work if there is no trend.
GMMA Compression Breakout Strategy
Moving averages also serve as levels of support and resistance.
When both groups of moving averages compress on the same candlestick, it could signify a change in the general trend.
Here’s how it works:
- Look for a candlestick with highs and lows that pierce all twelve moving averages.
- Place a purchase stop order above the candlestick’s peak and a sell stop order below the candlestick’s low.
- Make the opposing stop order (that wasn’t filled) your initial stop-loss level after it’s filled.
- If you’re long, trail your stop at the low (if long) or high (if short) of the previous candlestick until you’re stopped out of the trade.
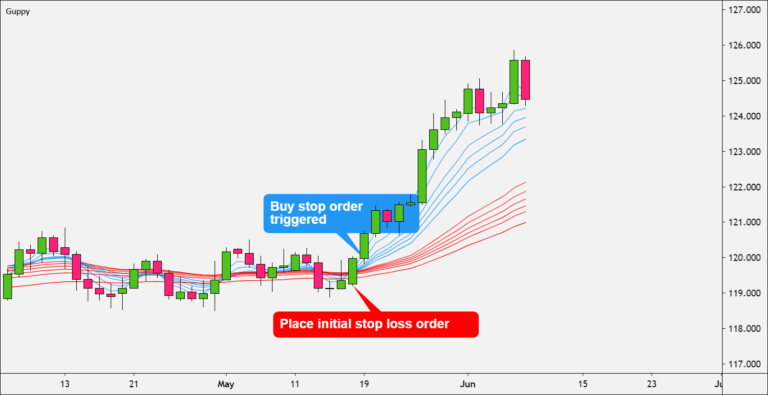
Consider the following scenario:

Both groups of EMAs have become tightly squeezed in the chart above. Take note of how the most recent candle opened below all moving averages and then managed to close above them all.
This might be translated as the price closing over a resistance level (the compressed EMAs).
Set a purchase stop order above the high of the candle and a sell stop order below the low of the candle.

The price rises in the next candle, triggering the purchase stop order. Your first stop loss is now your previous sell stop order.
The price rises in the next candle, triggering the purchase stop order. Your first stop loss is now your previous sell stop order.

The cost of living continues to grow. You can track your stop loss and utilize it as the next stop-loss whenever a candle strikes a new higher low until you are stopped out.
Limitations of the Guppy Multiple Moving Average (GMMA)
Guppy’s fundamental flaw is that it is a lagging indicator.
This is because the Guppy is made up of exponential moving averages (EMAs), which are lagging indicators, as we learned in a previous lesson.
After the trend has begun, a lagging indicator sends out a signal.
Waiting for the EMAs to cross over can result in an entry or exit that is too late because the price has already changed significantly.
You’ll always get into a trade AFTER the trend has already started, and you’ll always get out of a trade AFTER the trend has already ended, using any trend-following indicator.
It’s named a trend-FOLLOWING indicator for a reason. You don’t try to foresee when a trend will begin; instead, you wait for it to form before following it.
Whipsaws are a problem with all moving averages.
A whipsaw happens when the EMAs cross again, signaling an exit, but instead of moving in the predicted direction, price moves in the other direction, forcing the EMAs to cross again, signaling an entry (and realized loss).
SUMMARY
A trend-following system is the Guppy Multiple Moving Average.
When you trade with the trend, you are more likely to gain than lose.
The Guppy can assist you in visualizing both trend reversal and trend continuation possibilities.
The Guppy technique, despite being a simple indicator, works best when the price is in a clear trend.
There is no such thing as a technical indicator that is always correct. (Please let us know if you find one.)
Here are some trading recommendations for the Guppy:
- Make a trade in the direction of the EMA’s long-term group.
- Long-term trend strength is defined by the degree and nature of separation in the long-term group of EMAs.
- The short-term market sentiment is defined by the degree and character of separation in the short-term group of EMAs.
- Current market mood and the broader trend are in sync when both groups are trending in the same direction (up or down).
- A simultaneous compression of both groups implies the possibility of a trend change.
Looking for a highly rated forex fund manager?
Fx Pips Guru has a strong group of forex experts who are managing forex accounts of our clients from different brokers dedicatedly. Just hire our forex fund managers here: https://www.fxpipsguru.com/forex-fund-manager/ .